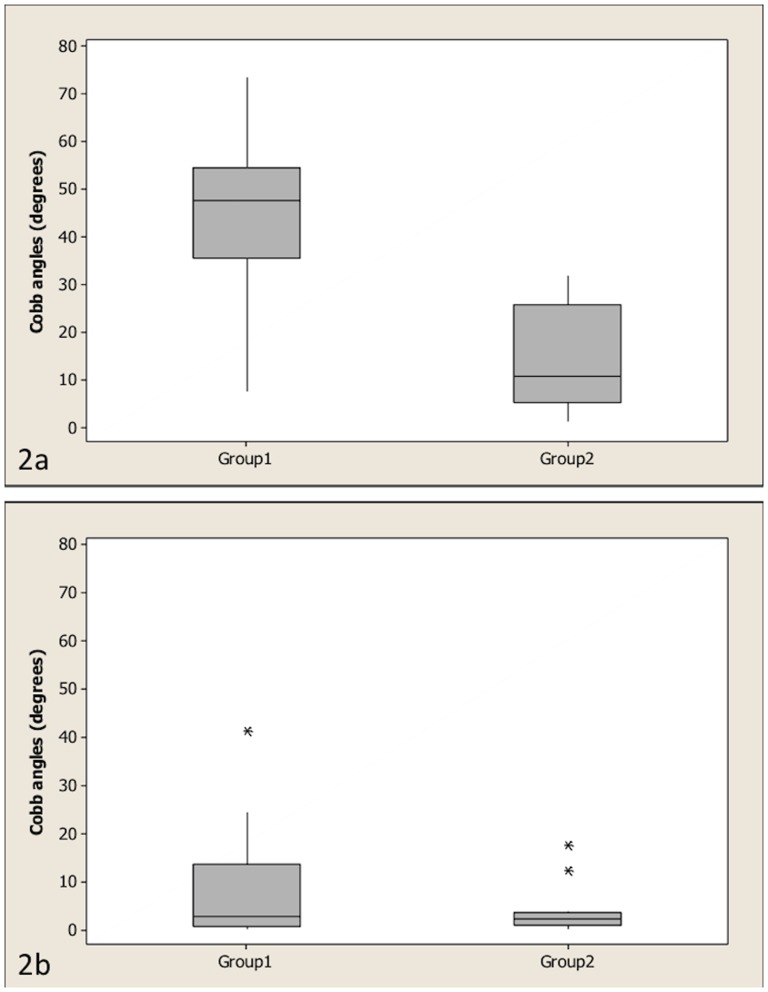
Figure 2. Boxplots of the two groups.
Boxplots of the kyphotic Cobb angles for group1 (dogs with associated neurological deficits) and group 2 (dogs without associated neurological deficits) (2a) (P<0.001) and boxplots of the scoliotic angles of groups 1 and 2 (2b) (P = 0.55). The Mann-Whitney test was used to compare both groups. The bottom and top lines of the box represent the first and third quartiles, the band inside the box represents the median and the asterisks outside the box and whisker plot represent outliers.

