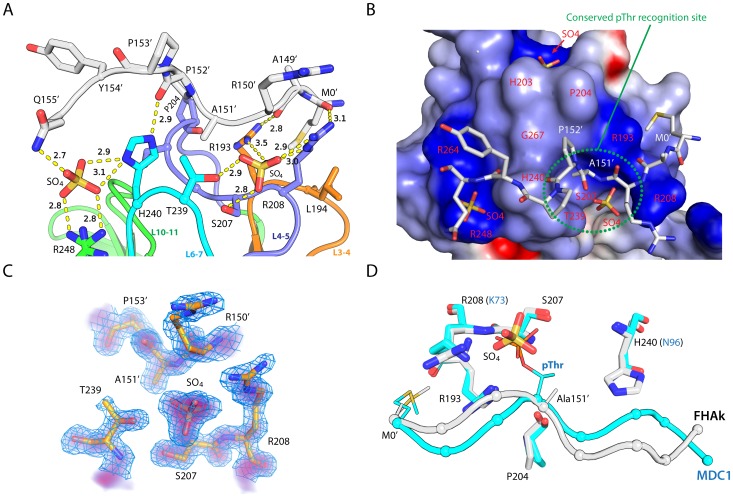
Figure 3. Recognition of a phosphopolypeptide mimic by the FHA domain of kanadaptin.
(A) Interaction between the peptide (gray), the sulfates (orange) and the kanadaptin-FHA domain. Each loop involved in binding peptide and sulfate is in a different color. Hydrogen bonds are denoted by dashed lines, and corresponding distances in Å are indicated. Residues from the symmetry-related molecule are indicated by primed symbols. (B) Electrostatic surface potential of the kanadaptin-FHA domain (scale from −10 to +10 kT/e; blue, positive; red, negative). The bound peptide and sulfates are shown as sticks. (C) 2Fo-Fc density near the putative pThr binding site. The mesh (blue) is contoured at 1.0 sigma level, and the density level is represented by a linear color gradient from blue (1.0 sigma) to red (5.0 sigma). (D) Comparison of the ligand conformation in FHA domains of kanadaptin (gray) and MDC1 (cyan, PDB ID 3unn) with the peptide ligand represented as tubes with Cα atoms marked by spheres. Side chains of ligands [methionine and pThr (or Ala151/SO4 in kanadaptin] and receptors are shown as thin and thick sticks respectively.

