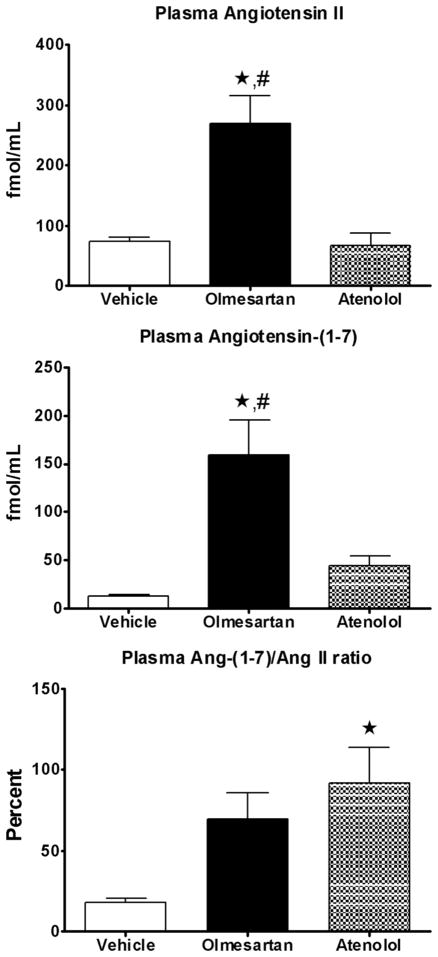
Figure 1.
Angiotensin peptides concentrations in plasma after 8 weeks of treatment. Values are the mean ± standard error of the mean (SEM) of spontaneously hypertensive rats (SHRs) given vehicle (white bar), olmesartan (black bar), or atenolol (grey bar). *p < 0.05 versus vehicle; #p < 0.05 versus atenolol-treated SHRs.

