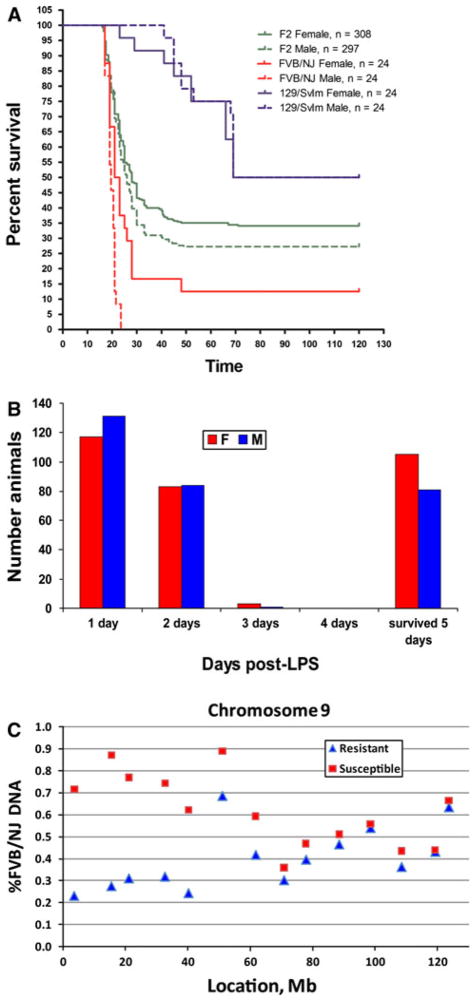
Fig. 1.
Mapping of morbidity phenotypes in [129S1/SvImJ × FVB/NJ F2] mice. a Kaplan–Meier survival curves for the sensitive FVB/NJ strains of mice (red), resistant 129S1/SvImJ mice (blue), and 129S1/SvImJ × FVB/NJ F2 progeny (green), with solid lines representing females and dashed lines representing males. F2 generation exhibits an intermediate phenotype between the two parental strains with a small difference (~5%) in morbidity of males and females. b Distribution of morbidity by day. Approximately 70% of male and female mice die within the first 2 days, while the remaining 30% survive for 5 days, suggesting that a single gene is responsible for the difference in morbidity between 129S1/SvImJ and FVB/NJ mice. c %FVB DNA in the sensitive DNA pool (<24 h survival, N = 240 mice; red squares) and resistant DNA pool (survived 5 days, N = 190; blue triangles) for SNP markers on chromosome 9. The locus is identified by the facts that %FVB DNA deviates from 50% and that sensitive and resistant pools diverge in their %FVB DNA between 0 and 40 Mb

