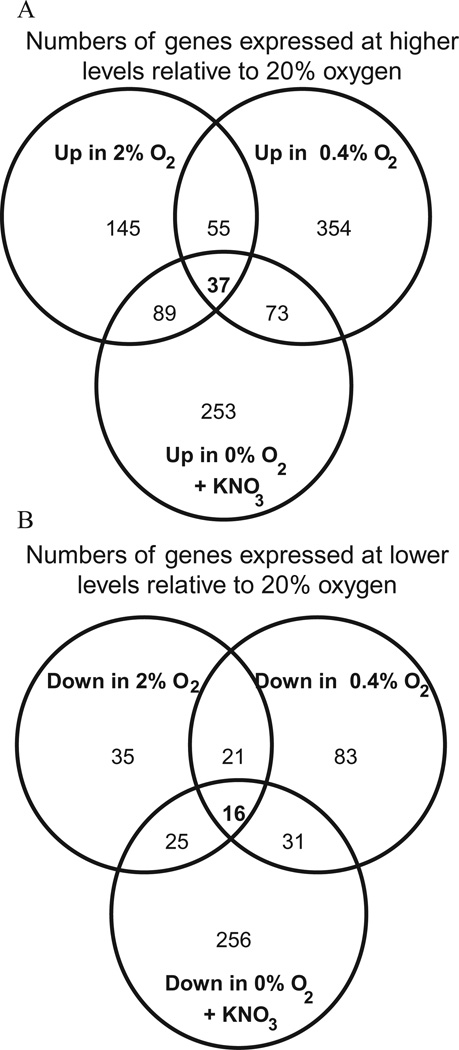
Fig. 3.
Numbers of genes that are differentially expressed in response to growth at different concentrations of oxygen. Gene expression profiles of cells grown at the indicated concentration of oxygen were compared with that of cells grown with 20% oxygen. A 2.5-fold cut-off and a P-value threshold of 0.001 were applied to transcriptome data.
A. Numbers of genes expressed at higher levels relative to 20% oxygen.
B. Numbers of genes expressed at lower levels relative to 20% oxygen.

