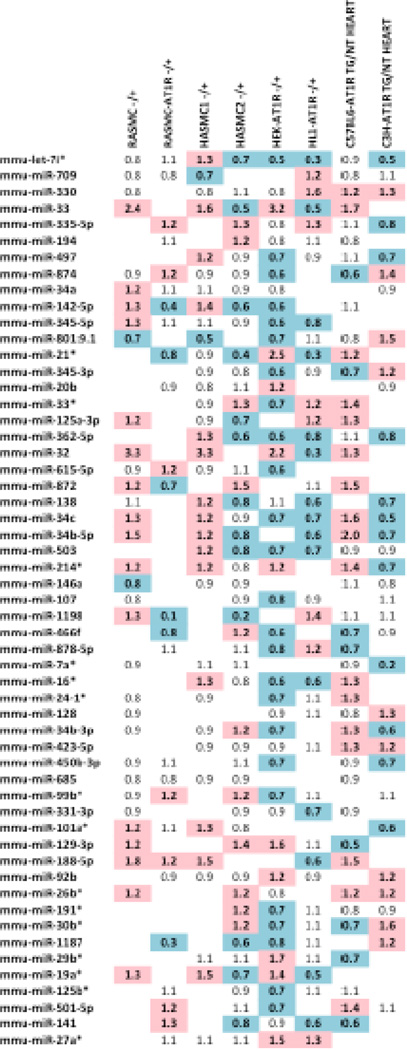
Fig. 2. Common miRNAs expressed across AngII activated samples.
Log2 fold change in miRNA gene expression between untreated and AngII/AT1R samples. A blue color indicates that the miRNA is downregulated (< 0.7) in response to the treatment condition (see Table 1 for descriptions of treatments). A red color indicates that the miRNA is upregulated (> 1.2).

