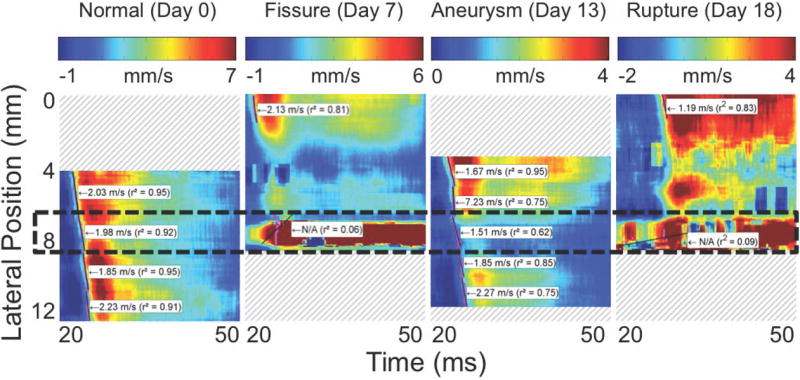
Figure 4.

Spatiotemporal maps of wall displacement in the (a) normal, (b) fissured, (c) aneurysmal, and (d) ruptured aortas shown in Figures 2 and 3. The intensity scales for each plot are the same as their respective cases in Figure 3. As in Figures 2 and 3, the lateral position axes start at different offsets in order to align the fields of view to the same anatomical landmarks. Piecewise PWV and r2 are also shown in each case; some regions of (b) and (d) are omitted owing to noise.
