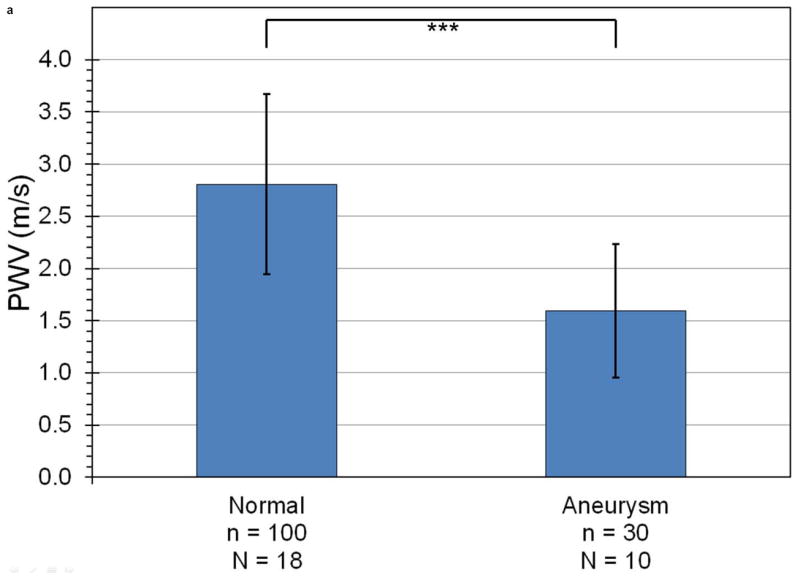
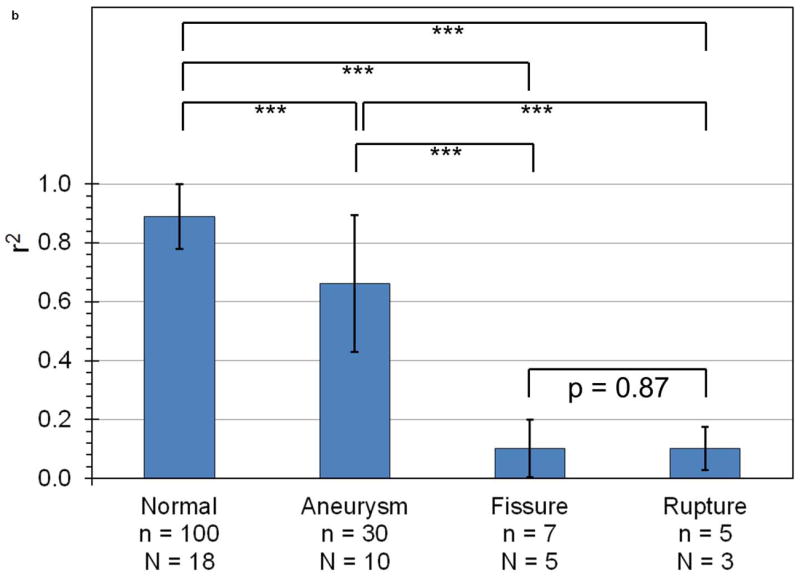
Figure 5.


Mean and standard deviation of (a) PWV and (b) r2 for linear regressions performed on all observed cases of normal aortas, aneurysms, fissures, and ruptures. The number of acquisitions (n) and mice (N) being averaged across are also indicated. With the exception of fissures compared to ruptures, PWV and r2 are statistically significant differentiators between any two categories (p < 0.001, indicated by the triple asterisk).
