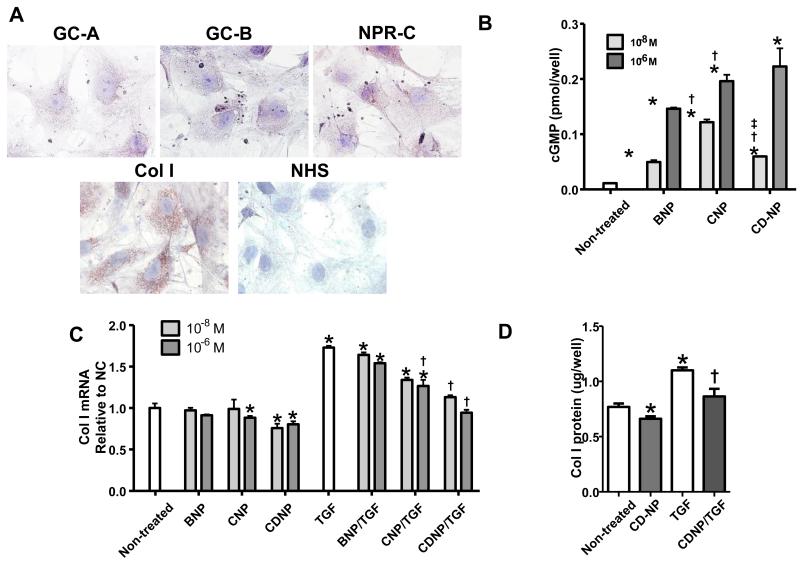
Figure 4. In vitro study in CFs.
A: Immunocytochemical staining for GC-A, GC-B, NPR-C, and Col I protein expression in CFs at × 100 objective magnification. B: cGMP generation in CFs stimulated by 10−8 and 10−6 M BNP, CNP, or CD-NP. Values are from three experiments and the mean of three samples per treatment. *p<0.05 vs non-treated cells, †p<0.05 vs BNP at the same concentration, ‡p<0.05 vs CNP at the same concentration. C: Col I mRNA expression with or without TGF beta-1 (5 ng/ml) treatment in CFs pretreated with or without 10−8 and 10−6 M BNP, CNP, or CD-NP. Values are from three experiments and the mean of three samples per treatment. *p<0.05 vs non-treated cells, †p<0.05 vs TGF. D: Col I protein expression with or without TGF beta-1 (5 ng/ml) treatment in CFs pretreated with or without 10−6 M CD-NP, determined by Col I ELISA. Values are from three experiments and the mean of three samples per treatment. *p<0.05 vs non-treated cells, †p<0.05 vs TGF.

