
Figure 3.
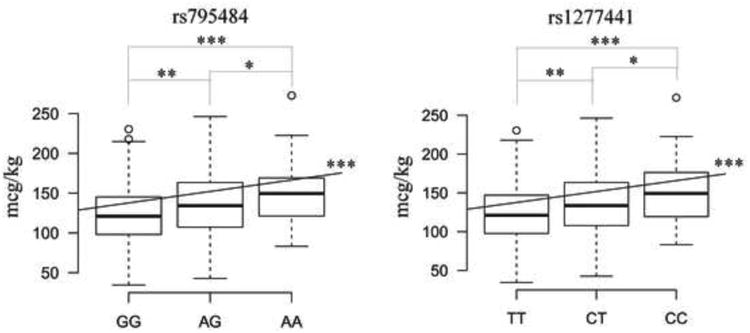
Box plots showing the distribution of total morphine dose according to single nucleotide polymorphism (SNP) genotype in the combined discovery and replication cohorts of European Caucasian ancestry. The X axes represent each SNP genotype group: GG, AG, AA for rs 795484; TT, CT, CC for 1277441 with the nucleoside base abbreviations: A=adenine, C=cytosine, G=guanine, and T=thymine. The Y axes show total morphine dose required in mcg/kg. The bottom border of each box represents the first quartile of data (total morphine administered in each SNP genotype group), the top border is the third quartile, and the thick horizontal segment within each box indicates the median. The end of the lower whisker and that of the upper whisker represent the lowest datum and the highest datum within 1.5 interquartile range (IQR) of the lower quartile and 1.5 IQR of the upper quartile respectively. Open dots beyond the whiskers indicate outliers. Asterisks indicate significance levels: * p-value <0.05, ** p-value < 0.005, and *** p-value < 1×10⁻⁴ for two-sided t-tests or linear regressions.