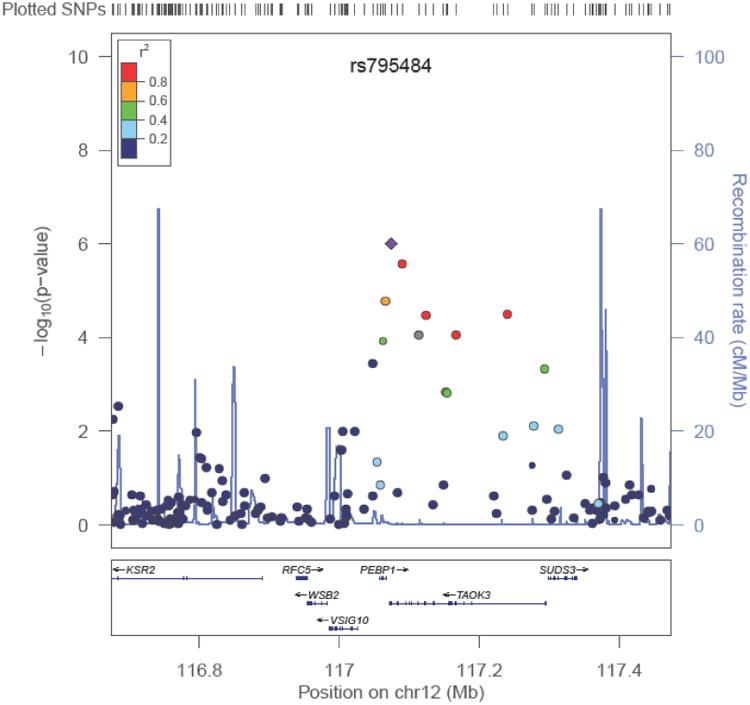
Figure 4.

Regional association plot for rs795484. SNPs are plotted by chromosomal position in a 400-kb window against their negative logarithm of P-values for association with total morphine sulfate dose in the European Caucasian discovery cohort. The color of each SNP reflects its LD with rs795484. The r2 values were estimated from the Hapmap CEU data.
