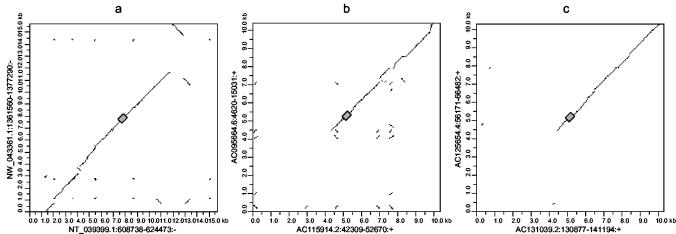
FIG. 4.
Dot plots of aligned common insertions in mouse and rat betaretroviral elements. Alignments and dot plots were generated as described in Materials and Methods. In all cases, the mouse and rat elements are on the horizontal and vertical axes, respectively. The grey boxes represent the retroviral regions. (a) Flanking sequences of 7.5 kb on either side of the pol region of MmERV-β2_NT_039339 and RnERV-β2_NW_0433361. (b) Flanking sequences of 5 kb on either side of RMER16 LTRs in mouse (accession number AC115914; horizontal axis) and rat (accession number AC095664; vertical axis) genomes. (c) Data in this panel are the same as described for panel b with mouse (accession number AC131039; horizontal axis) and rat (accession number AC125654; vertical axis) RMER16 LTRs. Notations along axes are accession numbers followed by the coordinates of the first and last nucleotides of the aligned sequence in the contig or clone and the orientation of the sequence relative to the contig or clone. +, element and contig or clone are in the same orientation; −, element and contig or clone are in opposite orientations.

