
Figure 13.
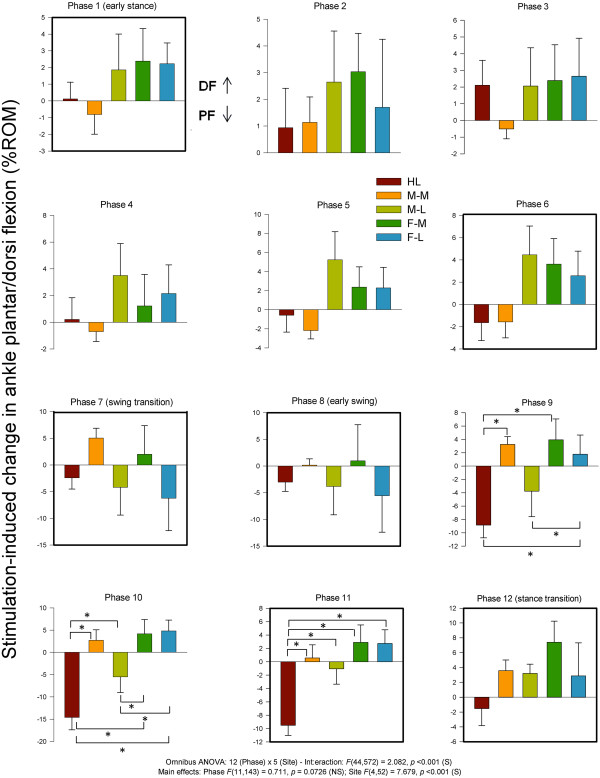
Stimulation-induced average changes in ankle joint kinematics for dorsiflexion and plantarflexion (dorsiflexion = up). Data are percentages normalized to maximum range of motion across all phases of walking. Phases of walking analyzed with planned comparisons are indicated by black borders. *indicates statistical differences at p < 0.05 between stimulation conditions within a phase.