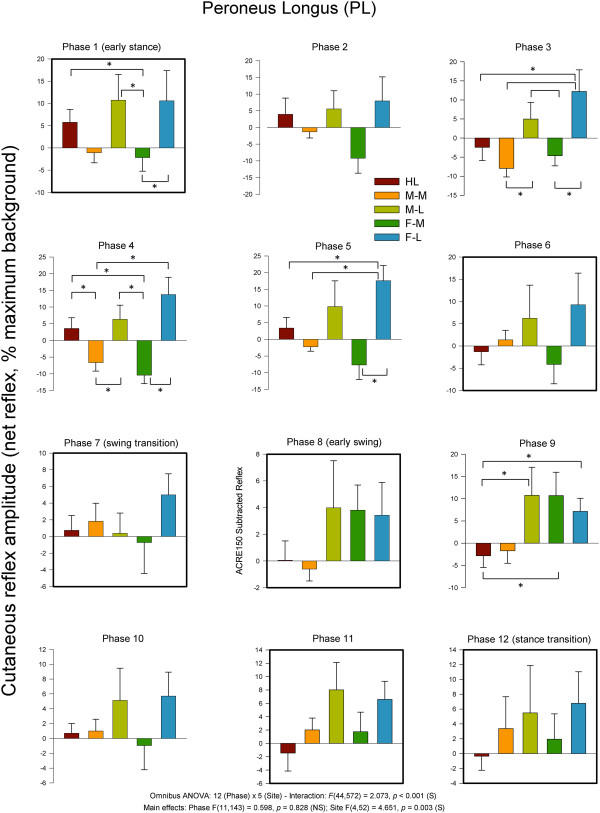
Figure 6.

Average quantified net (ACRE150) cutaneous reflexes across all 12 phases of the step cycle for ankle plantarflexor and evertor muscle peroneus longus. Data are percentages normalized to maximum background EMG measured across all phases of walking. Negative values indicate overall suppression and positive values overall facilitation of muscle activity. There were significant main effects for phase and stimulus region as well as a phase × region interaction. Phases of walking analyzed with planned comparisons are indicated by black borders. *indicates statistical differences at p < 0.05 between stimulation conditions within a phase.
