
Figure 9.
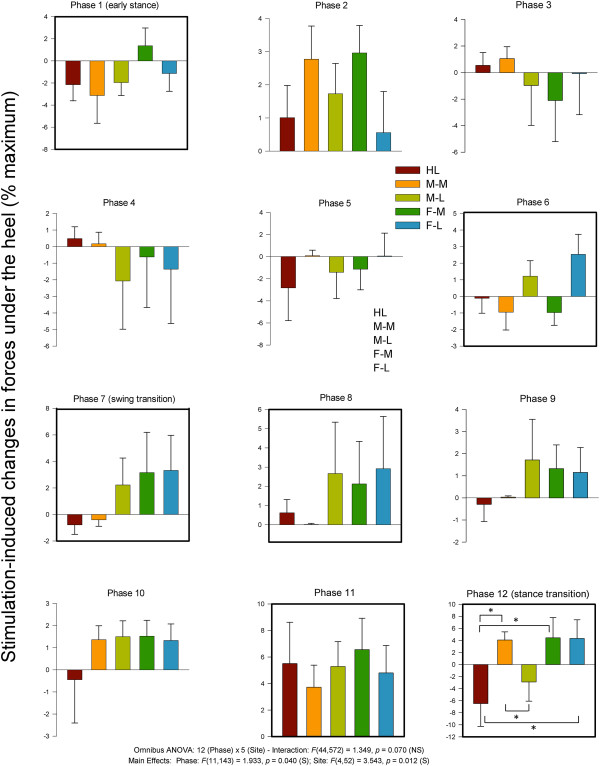
Stimulation-induced average changes in forces under the foot detected by FSRs at the heel. Data are percentages normalized to maximum FSR load detected in the stance phase of walking. Phases of walking analyzed with planned comparisons are indicated by black borders. *indicates statistical differences at p < 0.05 between stimulation conditions within a phase.