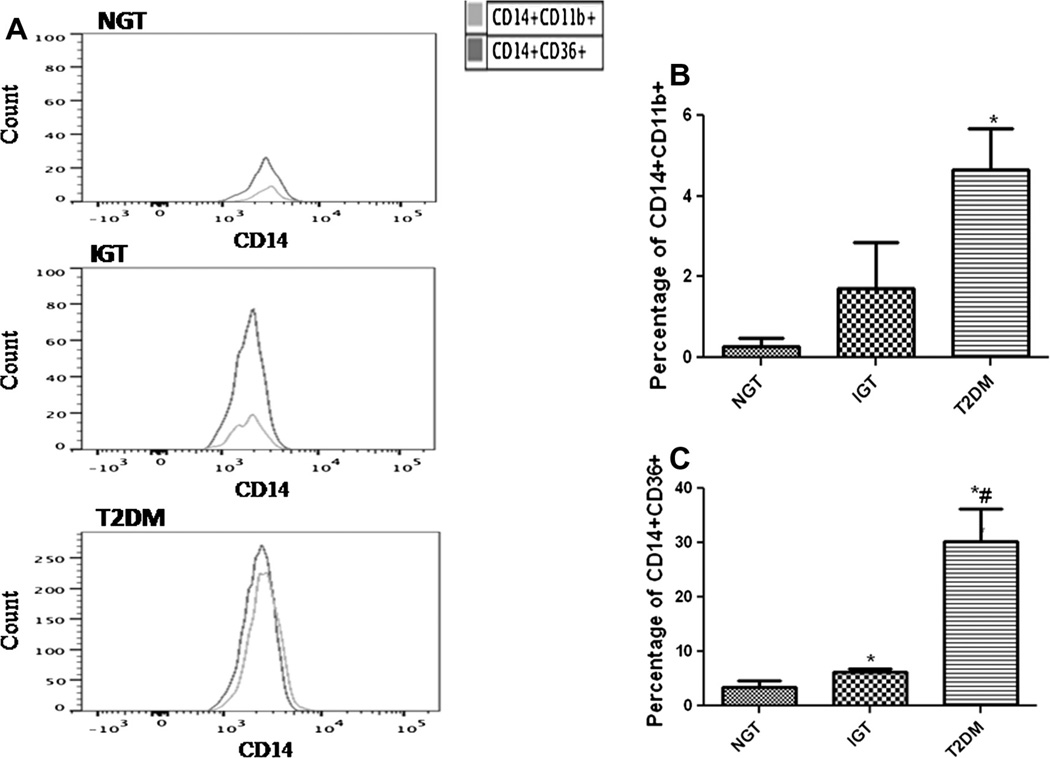
Fig. 3.
CD11b and CD36 expression on monocytes. (A) Representative flow cytometry analysis showing the expression of CD11b and CD36 as an overlaying histogram. Cumulative data on the percentage of CD14+ monocytes expressing CD11b (B) and CD36 (C) in the study subjects (n = 10 each). Data are represented as the Mean ± SE. *p < 0.05 compared to NGT, #p < 0.05 compared to IGT.

