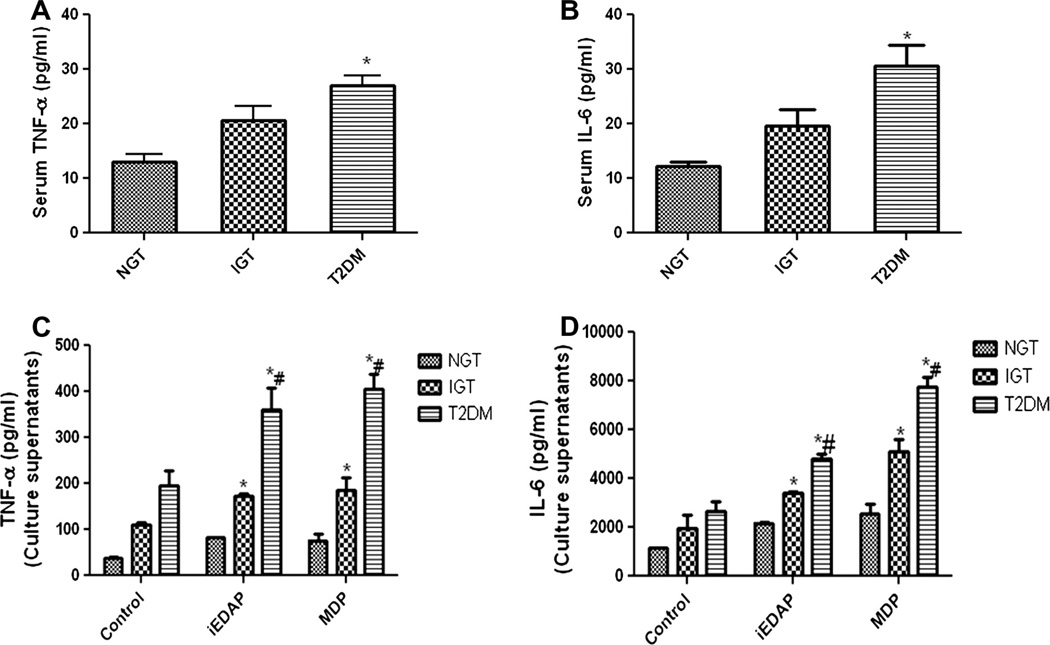
Fig. 6.
TNF-α, IL-6 levels in the serum and culture supernatants. ELISA showing the increased levels of serum TNF-α and IL-6 in the study subjects (A and B). Levels of TNF-α and IL-6 in the culture supernatants when monocytes from the study subjects were stimulated with NOD ligands (C and D). Data are expressed as Mean ± SD. *p < 0.05 compared to NGT; #p < 0.05 compared to IGT.

