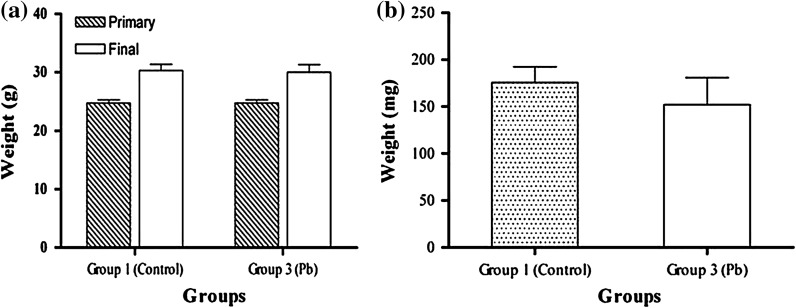
Fig. 2.
The comparison of weight averages of mice in group 3 (Pb- treated) and group 1 (Control) before (primary) and after treatment (final) (a) and weight averages of spleens between these groups after treatment (b). The average weight of mice after treatment in group 2 was found higher than in the control group but this difference was not significant (p < 0.05)

