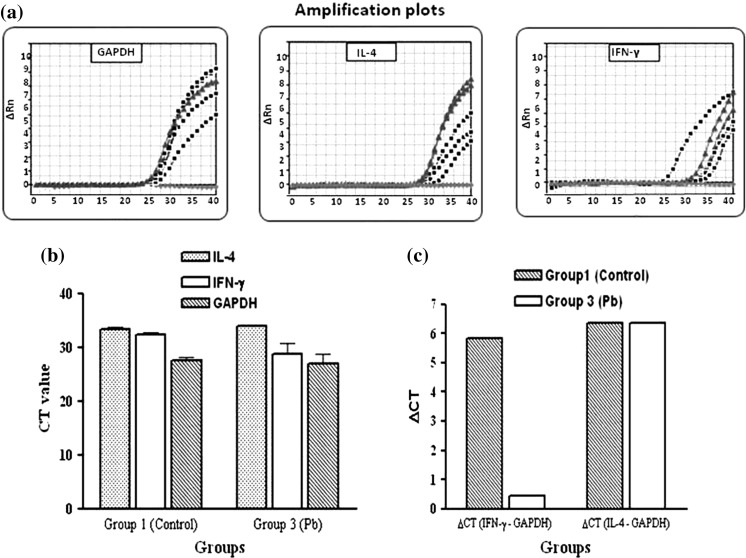
Fig. 4.
Real-time RT-PCR results for group 3 (Pb). (a) Amplification plots of GAPDH (left), IL-4 (middle) and IFN-γ (right). (b) Comparison of CT values. (c) Comparison of ΔCT between groups 1 (Control) and 3 (Pb) for IL-4 and IFN-γ. Test/comparator ratios of IFN-γ and IL-4 for groups 3 (Pb) was found 42.51 and -1.2, respectively

