
Figure 4.
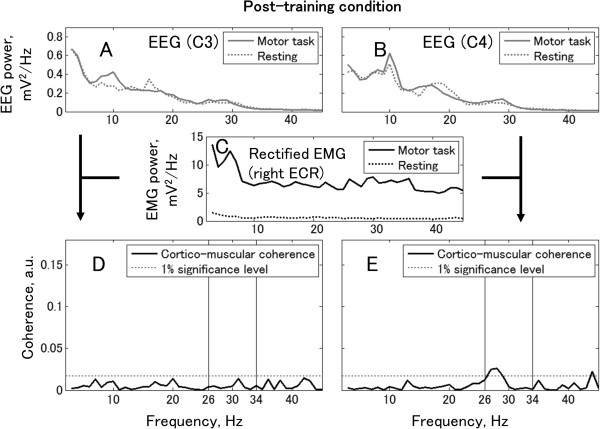
Cortico-muscular coherence and power spectra of EEG and rectified EMG in post-training condition. Top row shows the power spectra from the left EEG (Panel A) and the right EEG (Panel B). Middle row shows the power spectrum of rectified EMG recorded from the right ECR muscle (Panel C). Bottom row shows coherence between EEG and rectified EMG. The horizontal lines denote the 99% confidence limit. Panels D and E show EEG from C3 and C4, respectively.