
Figure 2.
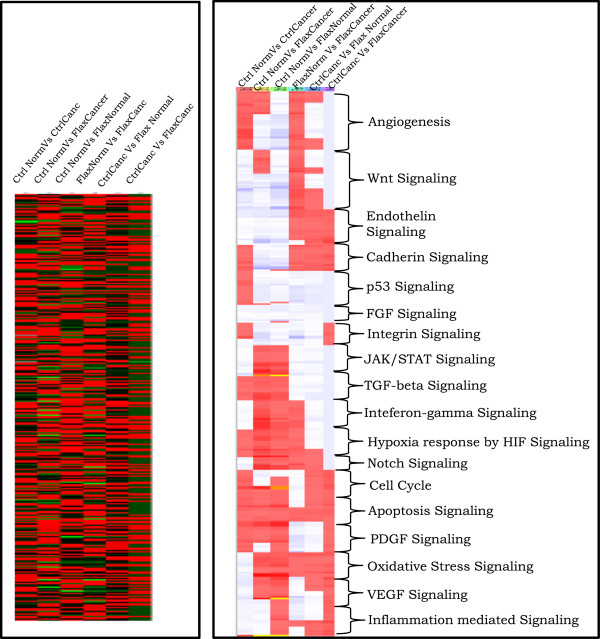
Microarray analysis showing the effects of flaxseed in ovarian cancer at whole genome level. Left, chicken whole genome wide heat map expression pattern at global level: All the gene probes used in the array which showed detectable level of expression during analysis were visualized using heat map to show their differential expression levels between the groups i.e. control-cancer vs. control-normal, control-cancer vs. flax-normal, control-cancer vs. flax-cancer, flax-cancer vs. flax-normal, flax-cancer vs. control normal and flax-normal vs. control normal. Right, heat map visualization of pathway associated genes: Genes representing the specific biological pathway involved in cancer progression were sorted and their expression levels were examined between the different analysis group and a heat map was generated for visualization.