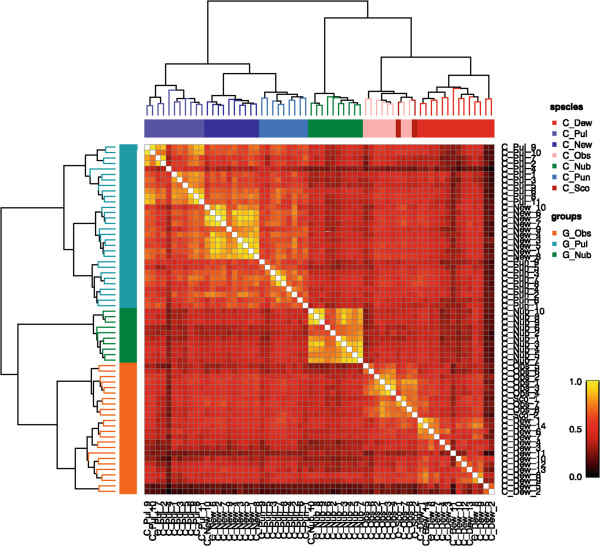
Figure 1.

Results from cluster analysis. 64 spectra from biting midges of 7 different species were clustered using Dice coefficients. A colour (heatmap) representation of the pairwise similarity (Dice) coefficients is shown. Above this, clustering of individual spectra, color-coded according to species, are shown in a dendrogram. On the left side, the same dendrogram is shown but color-coded according to species group.
