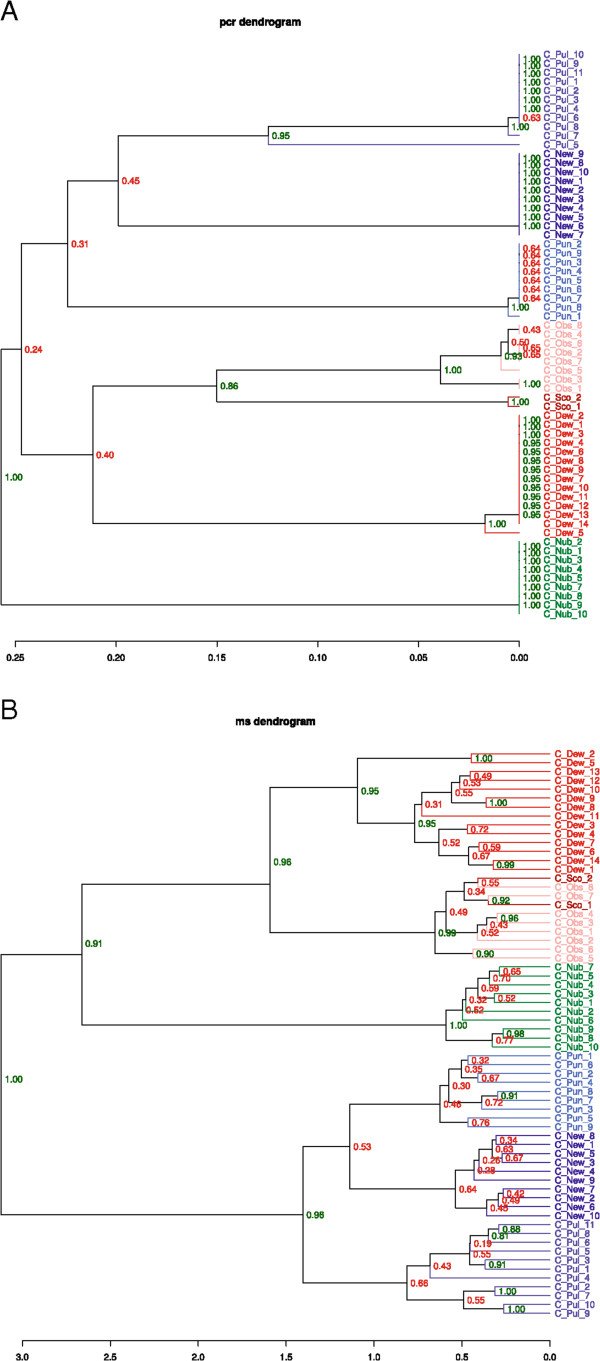
Figure 2.

Comparison of PCR dendrogram (A) and MS dendrogram (B). A: The PCR dendrogram is based on the COX1 DNA sequencing data, suggesting a possible phylogeny for the different species. B: The MS dendrogram is based on the MALDI-TOF MS data. Percentages of bootstrapping replicates supporting the location of individual nodes are indicated.
