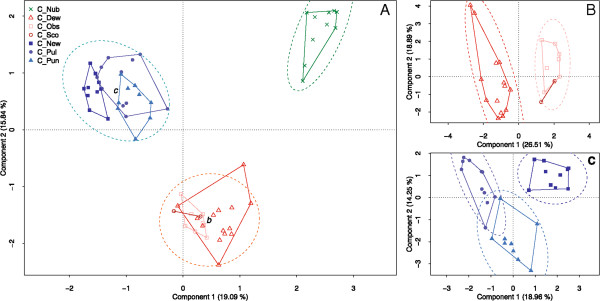
Figure 3.

Scatterplot from unbiased PCAs using 64 spectra from midges of 7 different Culicoides species. Species-specific colour coding corresponds to that shown in Figure 1. Spectra belonging to one species are outlined by convex shape. The dashed lines indicate 95% concentration ellipses. A: PCA containing all spectra; B spectra from the obsoletus group only; C: spectra from the pulicaris group only.
