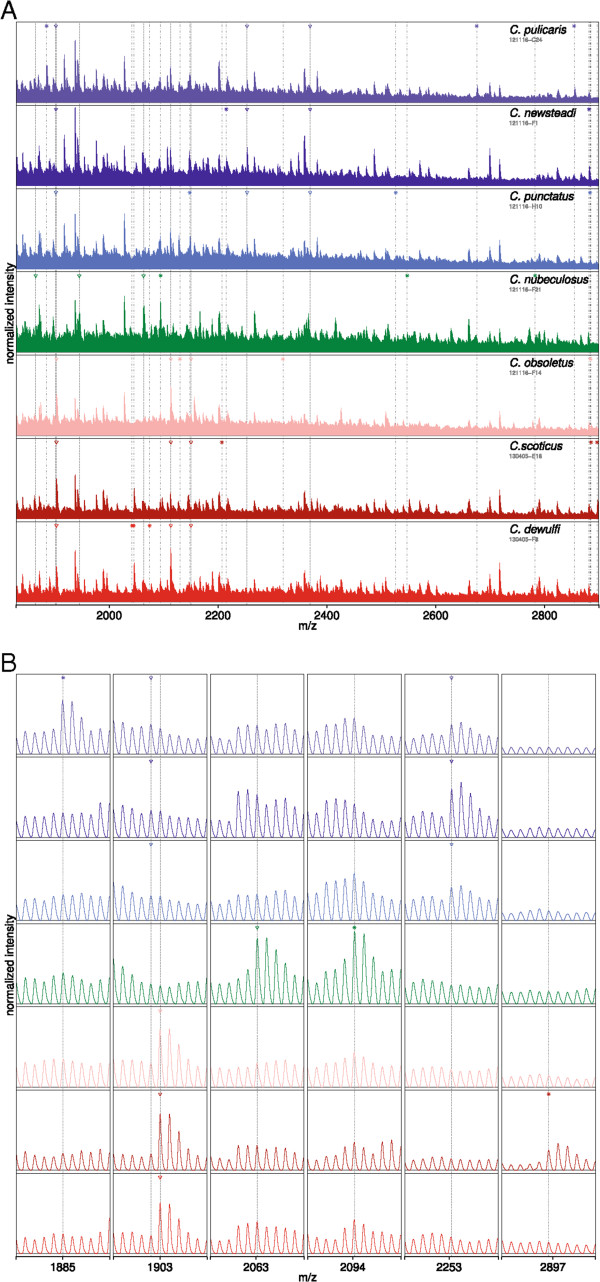
Figure 5.

Sections of 7 representative MALDI-TOF MS spectra of the 7 Culicoides species. A: The vertical, dash-dotted lines marked with an asterisk indicate monoisotopic peaks that are characteristic (but not exclusive) for one species (top 3 for each species). Likewise, the vertical, dashed lines marked with a triangle denote monoisotopic peaks that are characteristic for one certain species group (top 3 for each group). B: Zooms for six exemplary peaks. Except for the peak at 2,253.260 Da the peaks shown are all ranked under the top 40 shown in Figure 4.
