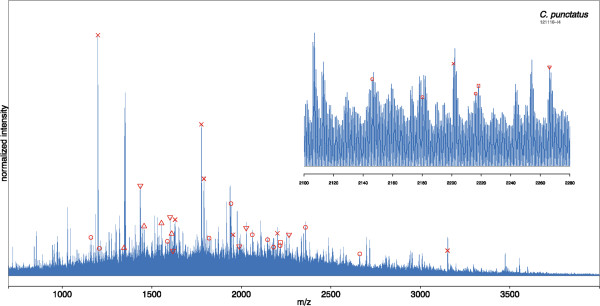
Figure 6.

MALDI-TOF MS spectrum of a representative specimen of C. punctatus . Peaks representing the peptides of five proteins identified by offline nano-HPLC-MALDI MS/MS are indicated. For better illustration, the m/z range from 2,100 to 2,280 Da has been magnified. x = actin; â–³ = ATP-Synthase alpha subunit (mitochondrial); â–½ = ATP-Synthase beta subunit (mitochondrial); ○ = myosin; □ = tropomyosin.
