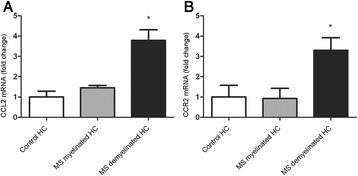
Figure 2.

Semi-quantitative RT-PCR analysis of CCL2 and CCR2 mRNA. qPCR of CCL2 (A) and CCR2 (B) mRNA in the hippocampus of control subjects, MS patients without hippocampal lesions and MS patients with hippocampal lesions. Data represent mean ± S.E.M. (n = 5) and are expressed relative to GAPDH.
