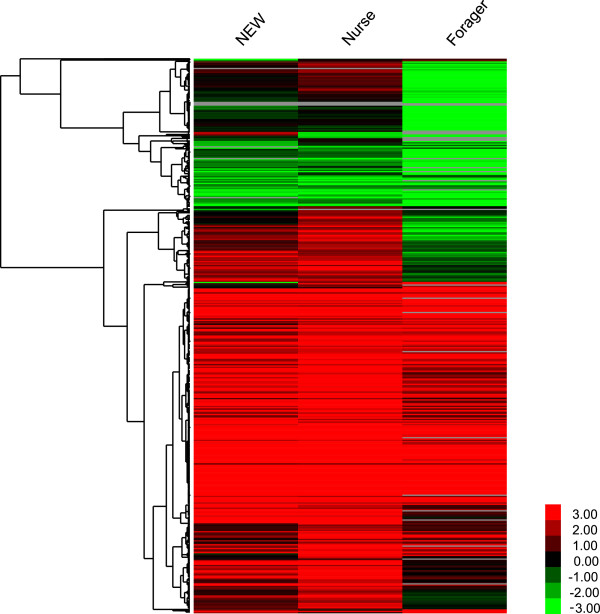
Figure 4.

Hierarchical clustering analysis of the 1417 DEGs between Apis mellifera and Apis cerana . For each gene, the TPM mean value of the two biological replicates at each stage was used to calculate the expression ratio between Apis mellifera and Apis cerana, i.e., TPM Apis mellifera / TPM Apis cerana. If the value of TPM Apis cerana was 0, it was replaced by 0.01. This ratio was log2-transformed and used for the clustering analysis, which was performed using the Cluster 3.0 and Treeview programs. Red represents up-regulated expression in Apis mellifera. Green represents up-regulated expression in Apis cerana.
