
Figure 3.
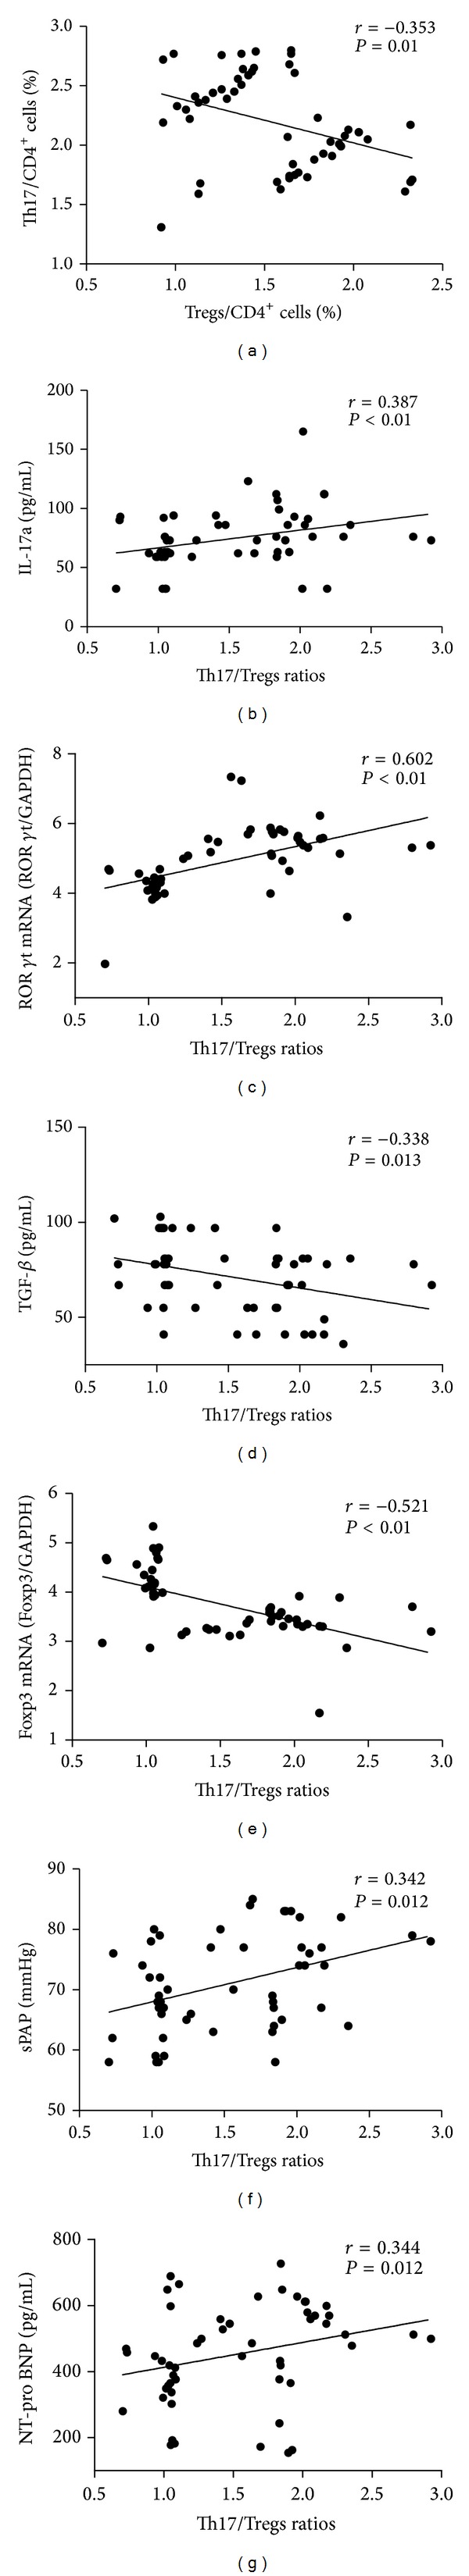
Correlation between Th17/Treg ratios and related cytokines; expression of ROR γt and Foxp3 mRNA and markers of disease severity in patients with CTD-aPAH. (a) Ratios of Treg to CD4+ cells negatively correlate with ratios of Th17 to CD4+ cells. (b) Ratios of Th17/Treg positively correlate with IL-17 concentrations. (c) Ratios of Th17/Treg positively correlate with expression of ROR γt mRNA. (d) Ratios of Th17/Treg negatively correlate with TGF-β concentrations. (e) Ratios of Th17/Treg negatively correlate with expression of Foxp3 mRNA. (f) Ratios of Th17/Treg positively correlate with levels of sPAP. (g) Ratios of Th17/Treg positively correlate with NT-pro BNP concentrations.