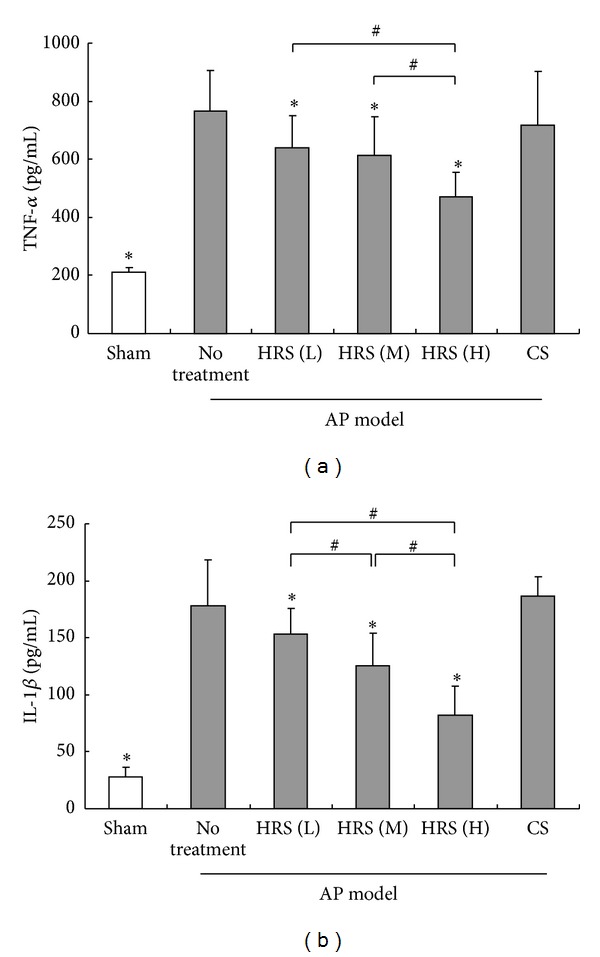
Figure 5.

Measurement of plasma cytokines concentration in mice. The HRS at various doses or control saline (CS) was injected intraperitoneally to AP mice 1 h after the final injection of cerulein, respectively. One hour later, animals in each group (n = 6) were killed and the blood samples were immediately collected. The plasma concentrations of TNF-α and IL-1β were measured using quantitative ELISA kits according to the manufacturer's instructions. *P < 0.05, compared with the group of AP mice with no treatment; # P < 0.05, compared in groups of AP mice treated with HRS at different doses; L: low dose (2 mL/kg × 3); M: middle dose (4 mL/kg × 3); H: high dose (8 mL/kg × 3).
