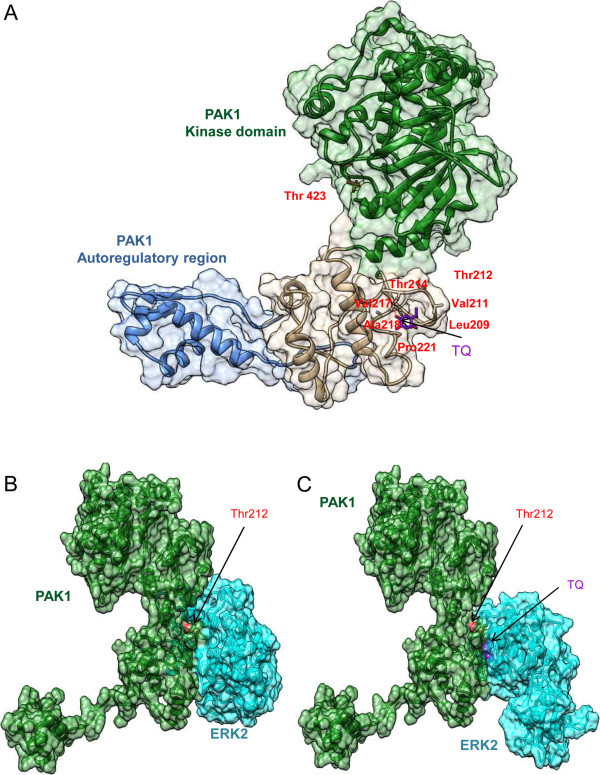
Figure 5.

TQ binds to PAK1 in the vicinity of Thr212. A. Surface representation of possible active conformation of PAK1 bound to TQ in the vicinity of pPAK1Thr212. TQ is represented in stick (purple). PAK1 residues within the 4 Å interface of the binding site are labelled in red. The kinase domain and the regulatory domain of PAK1 are marked in green and blue respectively. B. Surface representation of the PAK1-ERK2 complex. PAK1 and ERK2 are shown in green and cyan respectively. Position of Thr212 is highlighted in red. C. Surface representation of PAK1-ERK2 complex in the presence of TQ. Positions of Thr212 and TQ are highlighted in red and purple respectively.
