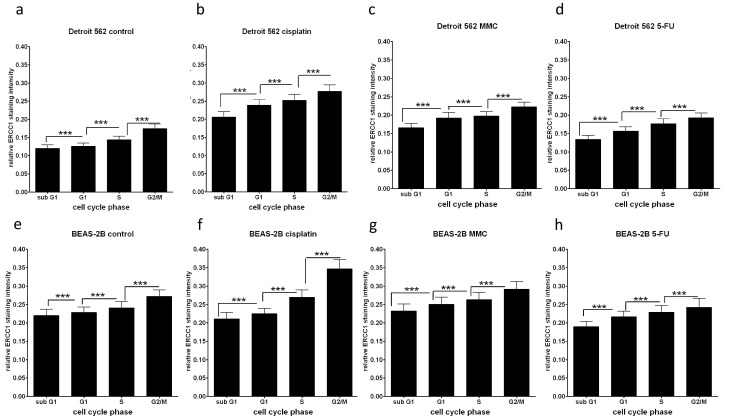
Fig. 4.

ERCC1-related fluorescence intensities in Detroit 562 (a–d) and BEAS-2B (e–h) cells gained with the ERCC1-specific immunocytochemical reaction. The “proportional events” (p e) (events corresponding to the ERCC1 fluorescence levels related to all events at the same cell cycle phase) were multiplied with the arbitrary fluorescence units (relative fluorescence intensity: I f) measured at the FL1 channel in all cell cycle phases to get the “cell-cycle-related ERCC1 immunocytochemical values” (p e * I f). These data represent both the relative distribution of the cells at cell cycle phases and the ERCC1 staining intensity of the cells within the cell cycle phases. In fact, the graphs represented show the cell cycle distribution of ERCC1 protein. Cell cycle-related ERCC1 staining intensity in untreated (a, e) and CDDP- (b, f), MMC- (c, g), and 5-FU-treated (d, h) conditions. ***p < 0.001
