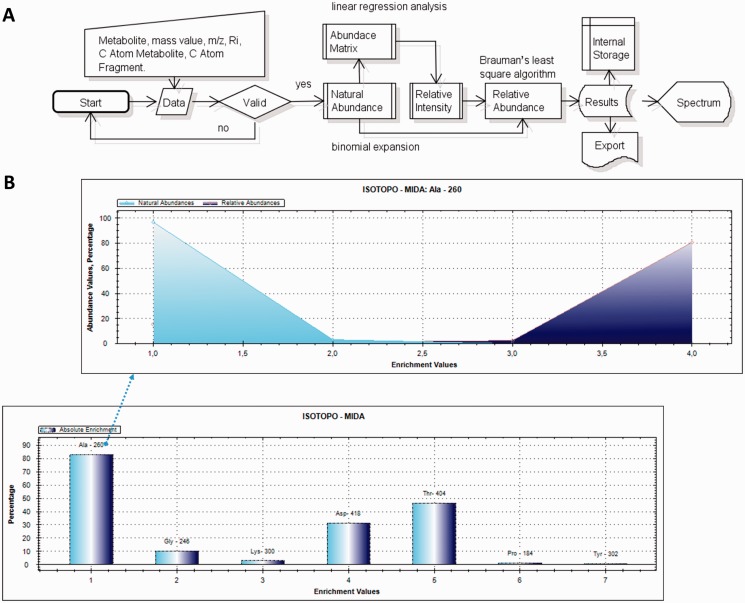
Figure 2.
Work flow of Isotopo and presentation of results: (A) Visual presentation of the unified mark-up language- based flow chart. The implemented flow of operations performed during experimental data input, processing, analysis and visualization is given. The presented workflow starts with the input of raw data, which are first validated and then analysed to estimate the natural abundance values (using abundance matrix and binomial expansion), relative intensity values and relative abundance values (using Brauman’s least square algorithm). Finally, the analysed results are visualized as a bar plot, stored in the internal storage and available to export. (B) The bar plot is based on the estimated absolute enrichment values of various amino acids from a labelling experiment with Salmonella typhimurium: alanine-260, glycine-246, lysine-300, aspartic acid-418, threonine-404, proline-184 and tyrosine-302, whereas the mountain plot gives in the example a detailed view based on the calculated natural and relative abundance values of alanine-260. Bar and mountain plots are different options to visualize different data sets.

