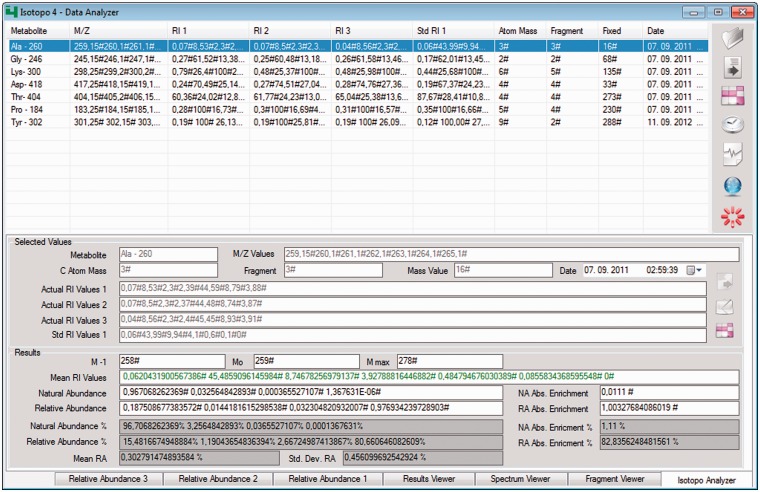
Figure 3.
Isotopo data analyser: GUI. The top right part of the GUI contains the options to open the file, remove loaded data (if it exists), measure the results, perform measurements of the whole data set, delete specific data, connect to the database to load data and close the application. The white list in the GUI (middle, left) is the container and holds the data. The bottom part of the GUI presents the estimated results and allows editing of all selected data. Data from three experimental data sets can be compared (relative abundance data sets 2 and 3 are in the back and not selected).

