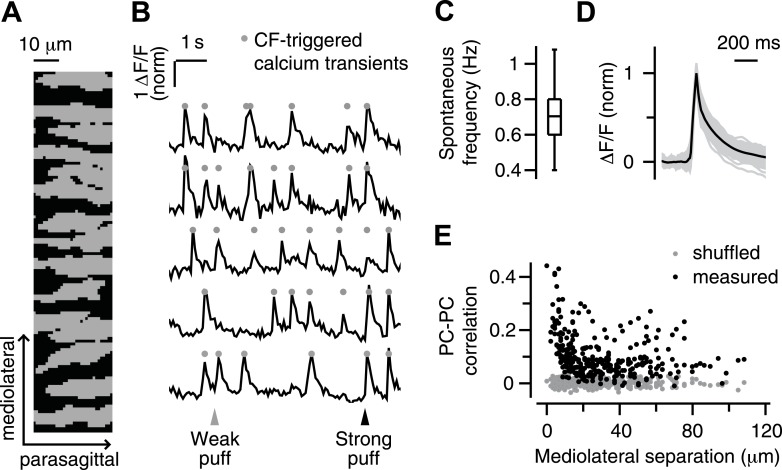
Figure 1. Imaging climbing fiber-triggered calcium transients in Purkinje cell dendrites.
(A) Field of view of an example experiment including 15 dendrites. (B) Example fluorescence traces of some of the dendrites in (A). Triangles indicate periocular airpuff stimuli of different strengths. Circles mark CF-triggered calcium events. (C) Box plot showing frequency of spontaneous calcium events across all dendrites. (D) Mean ΔF/F trace of spontaneous calcium events for all dendrites (gray lines; mean: black). (E) Pearson correlation coefficient of calcium events in pairs of dendrites as a function of the mediolateral separation (black: real data; gray: shuffled-frame control data).

