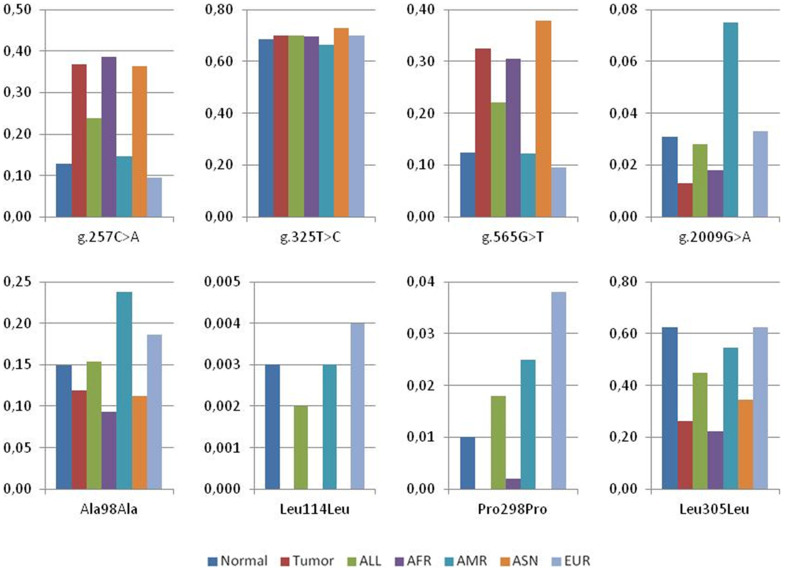
Figure 1. Allele frequencies of NAPRT1 genetic variants.
The graphs show the frequencies calculated from our results, both in normal and in tumor samples, for four non-coding and four silent variants. Data from 1000 Genomes reflecting the frequencies in different populations is also included. The novel polymorphisms g.2013A>G and g.676C>G as well as the two missense mutations Val106Met and Arg332Cys were not included since no data was available in the Ensembl Genome Browser. ALL: all individuals from phase 1 of the 1000 Genomes Project; AFR: African; AMR: American; ASN: East Asian; EUR: European.

