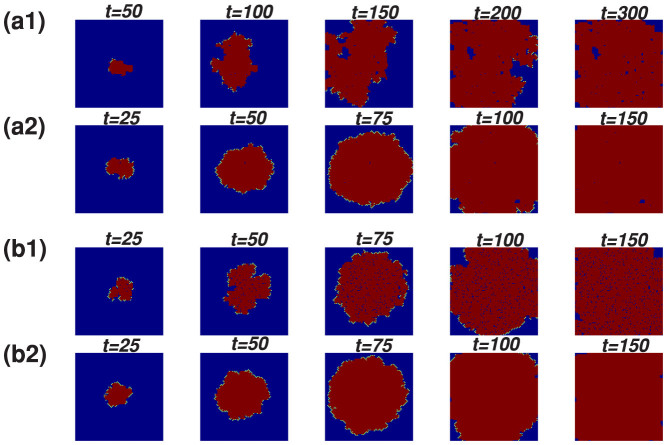
Figure 1. The time evolution of spatial patterns, for two different values of stickiness (a1) a = 0.40, (a2) a = 0.45 (bottom panel) where b = 0; and for two values of persistence (b1) b = −1.00, (b2) b = 1.00 (bottom panel) where a = 0.45.
Red sites represent recovered or alerted nodes, bright green sites represent infected ones, and blue sites denote susceptible nodes. Other parameters are chosen as ns = 2 and N = 101 × 101.

