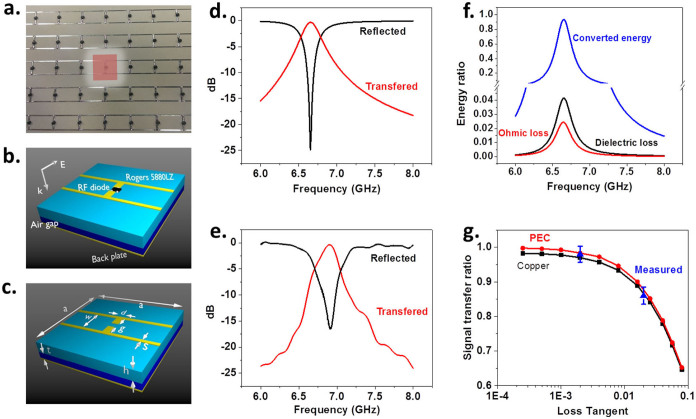
Figure 2. Schematics of the UEECA sample in the measurement of the signal transfer ratio spectrum in both simulations and measurement.
(a) The front view of the MA sample with RF diodes attached to each unit (highlighted regime). (b) Unit cell components and electric field. (c) Dimensions of a MA unit cell where a = 15 mm, d = 1 mm, g = 2 mm, s = 0.5 mm and w = 7 mm. (d) The HFSS simulated ratio of the reflected signal (black line) and the ratio of the signal being transferred to the RF diode (red line) in the frequency spectrum. (e) The corresponding experimental results. (f) The comparison between the converted energy, ohmic loss and dielectric loss. (g) The simulated maximum signal transfer ratio dependence of the permittivity loss tangent of the first separation layer. The material of the metal structure is chosen to be either copper (black line and markers) or PEC (red line and markers). The structural dimensions and the other material parameters are the same as in the previous simulation. The measured maximum signal transfer ratio using FR-4 and Rogers 5880LZ are plotted in (blue up triangles).

