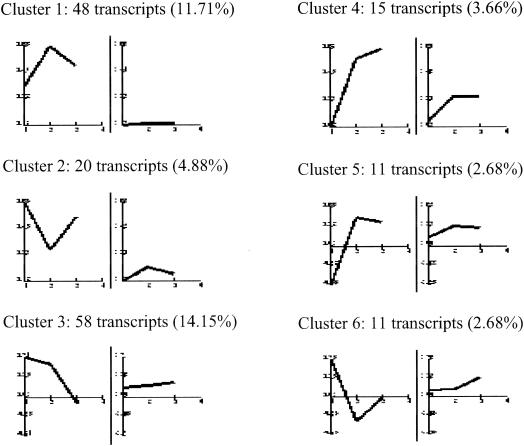
FIG. 3.
Characteristic expression patterns represented in clusters 1 to 6. Shown are mean values (left) and standard deviations (right) of the expression profiles of genes assigned to each cluster. Experimental points on the x axis are 1 for 2 h postinfection, 2 for 6 h postinfection, and 3 for 16 h postinfection. The y axis shows normalized expression values. The values in parentheses are percentages of genes in each cluster with reference to the total of 410 differentially expressed genes.

