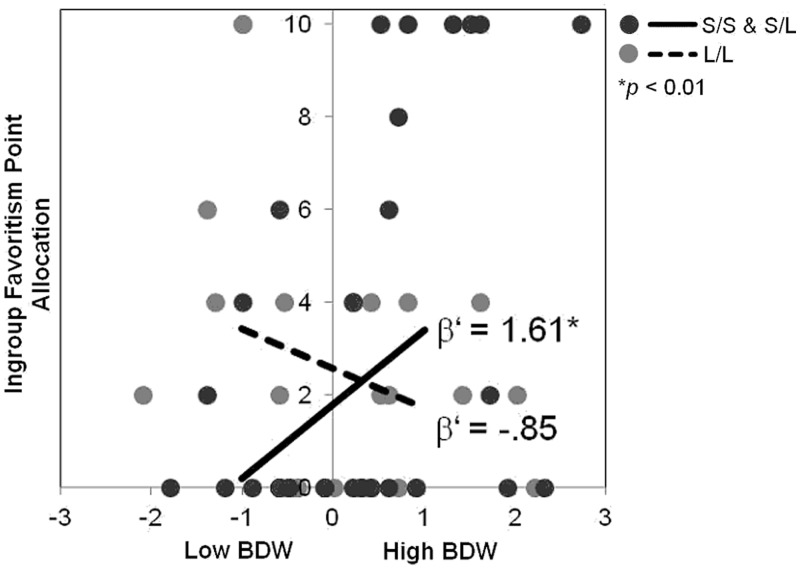
Fig. 3.
Interaction of 5-HTTLPR and BDW on intergroup bias in Study 2. BDW was associated with greater resource allocations favoring a member of the ingroup relative to a novel member of the threatening group for only the S-group, but not the L/L-group. Allocation decision (y-axis) reflects surplus points distributed to the ingroup member over the outgroup member (zero reflects an equal distribution). BDW (x-axis) is represented in Z-score values. Dots reflect participant scatter plot data. Lines reflect simple slopes for the interactions at low (−1 s.d.) and high (+1 s.d.) levels of BDW.

