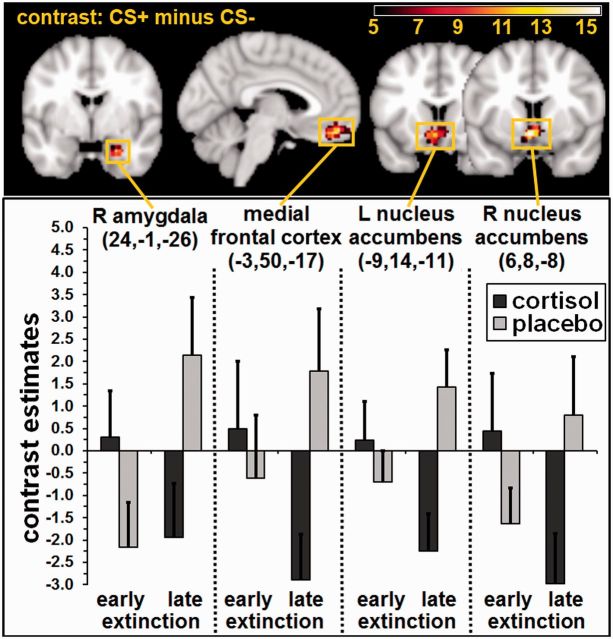
Fig. 2.
Neuronal activation during early vs late extinction for the contrast CS+ minus CS−. Data are masked with the respective ROI and illustrated with F ≥ 5.0 (see colour bar for exact F-values). The depicted slices were selected according to the reported activations in the right amygdala (y = −1), the medial frontal cortex (x = −3), as well as in the left (y = 14) and right nucleus accumbens (y = 8). Additionally, mean contrast estimates as well as the respective standard errors in the respective peak voxels are displayed in the bar graphs separately for the cortisol and the placebo group. Cortisol application reduced differential neuronal activation in fear extinction-related structures during late extinction. L = left, R = right.

