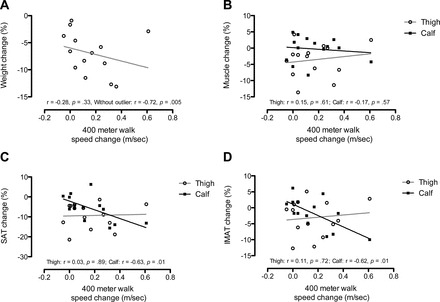
Figure 3.

Scatterplots and lines of best fit for the association between walking speed percent change and (A) total body weight, (B) muscle, (C) subcutaneous adipose tissue (SAT), and (D) intermuscular adipose tissue (IMAT) for thigh and calf regions.
