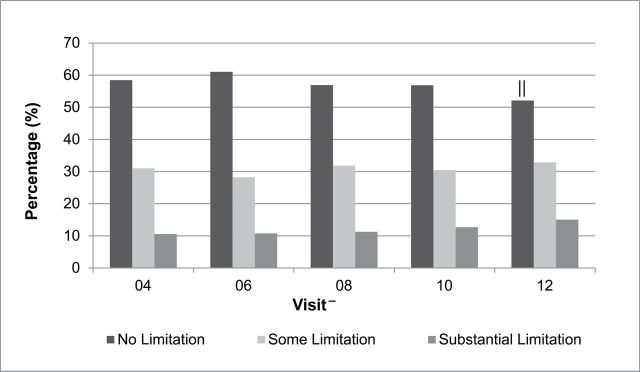
Figure 1.

Percentages of physical function limitation categories over time. *
No limitation: physical functioning score 86–100; some limitation: physical functioning score 51–85; substantial limitation: physical functioning score: ≤50.
-Cross-sectional sample size at each visit: visit-04 = 2,257, visit-06 = 2,142, visit-08 = 2,126, visit-10 = 2,091, visit-12 = 2,035. Common reasons for loss to follow-up: refusing to complete the form, missing the study visit and study deactivation.
|| p < .0001 for greater odds of substantial limitation versus no limitation and some limitation at visit-12 compared with visit-04.
