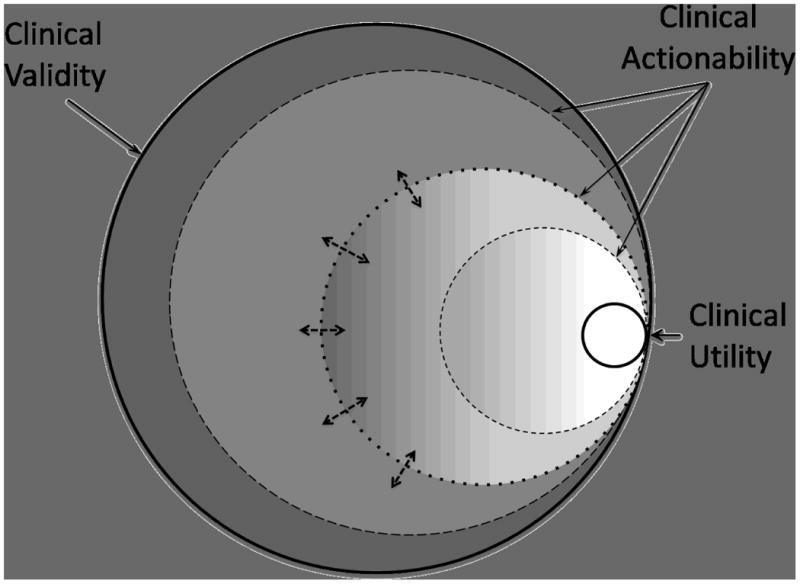
Figure 1.

Schematic diagram showing overlap of clinical validity (outer boundary, containing all genetic variants with a valid clinical association), clinical utility (inner white circle), and the boundaries of clinical actionability (shaded circles). Depending on the criteria used to define “actionability” (depicted by double arrows) the boundaries could be more or less inclusive (dashed circles). In this scheme, variants with clinical utility are a subset of all clinically actionable variants.
