
Figure 3.
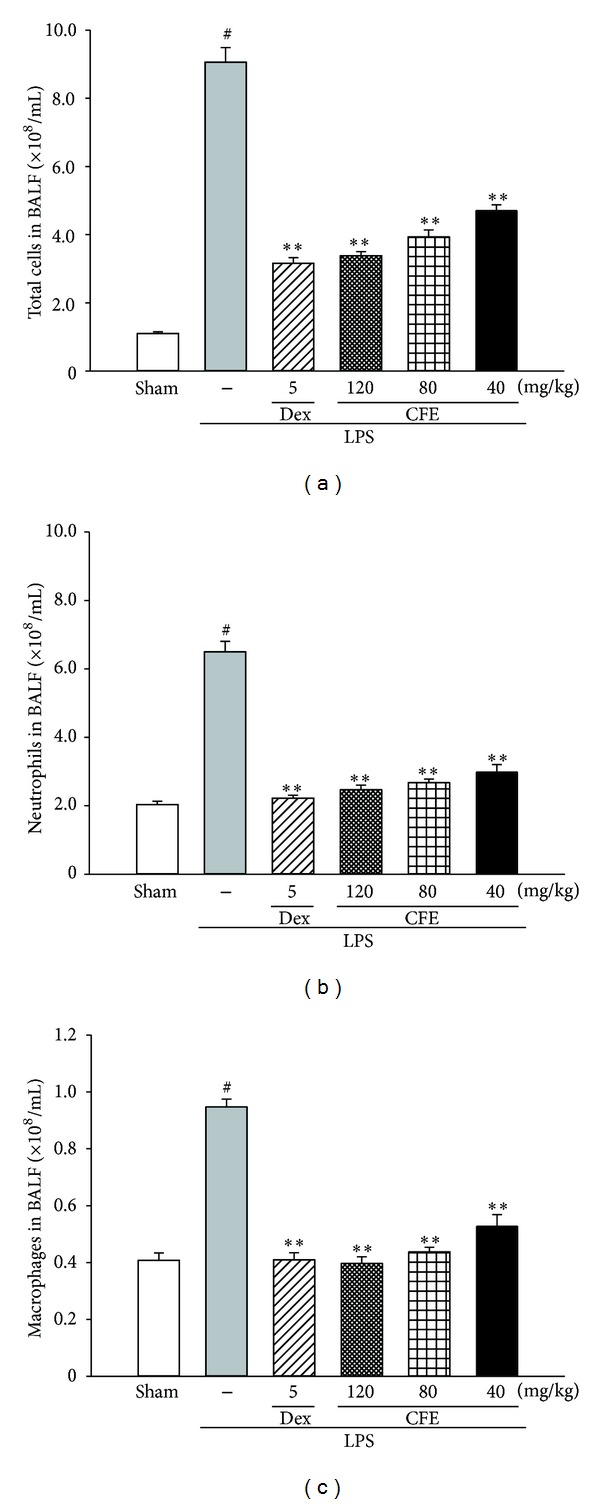
The effects of CFE on total cells (a), neutrophils (b), and macrophages (c) in BALF. Data was represented as the mean ± SEM (n = 10). # P < 0.01 compared to the sham group; *P < 0.05 and **P < 0.01 compared to the LPS group.
Official websites use .gov
A
.gov website belongs to an official
government organization in the United States.
Secure .gov websites use HTTPS
A lock (
) or https:// means you've safely
connected to the .gov website. Share sensitive
information only on official, secure websites.
The effects of CFE on total cells (a), neutrophils (b), and macrophages (c) in BALF. Data was represented as the mean ± SEM (n = 10). # P < 0.01 compared to the sham group; *P < 0.05 and **P < 0.01 compared to the LPS group.