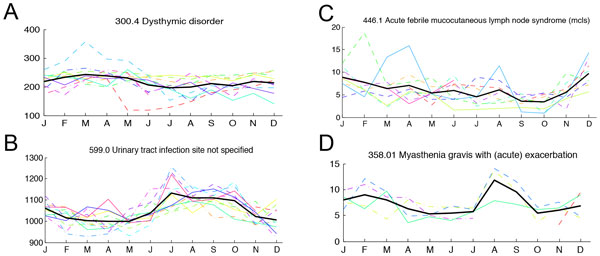
Figure 3.

Selected diseases with periodic signal. For four of the diseases discussed, the monthly incidence for all years is plotted together in order to view consistencies in the seasonal trend across different years. Each colored line again represents a year, with the bold black line the average across the years.
