
Figure 11.
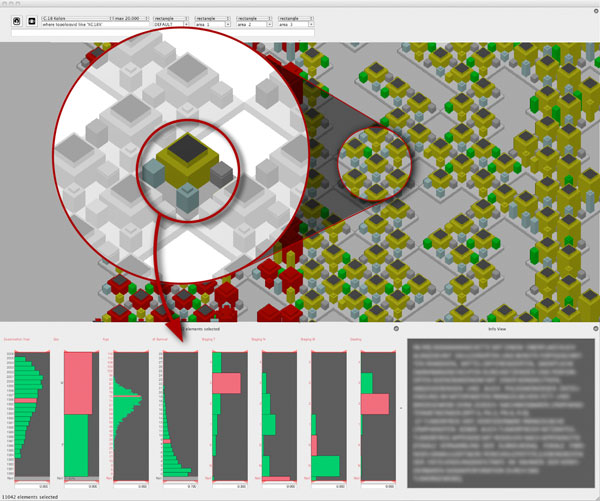
Colon cancer cases, manually grouped. The visualization is done with detail glyphs (figure11.png). Further magnification shows the glyphs in the detail view. The user can compare the N-staging, M-staging and the grading for a small number of glyphs. The disease analyser depicts the variable values of the current selected element in the histogram view. Additionally the full text diagnosis of the selected element is shown in a text window.