
Figure 5.
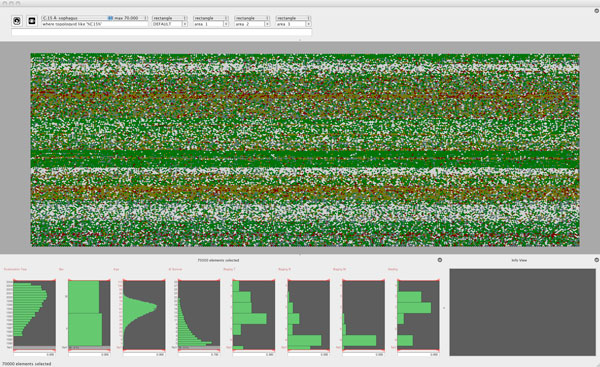
70000 cancer cases randomly selected from the disease database Distribution of Teaching Types (figure5.png). Approx. 70.000 randomly selected entities from the disease database. For this number of elements we use the pixel level for the data glyph, i.e. only the color of the glyph is given by its primary mapping, the T-staging. The spatial position of the glyphs in the starting view is just determined by the ordering of the cases within the database. In the lower part of the disease analyser histograms of the variables used in the glyph mapping are shown