
Figure 6.
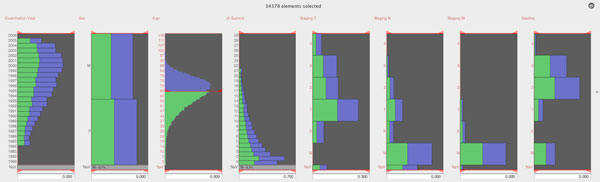
Selection of Subgroups (figure6.png). Histograms for the examination year, sex, age, disease free survival, T-staging, N-staging, M-staging and the grading. The histogram view shows the value distribution of the selected cases (green area) in relation to the overall distribution of cases (blue area). See also the additional file suppl_linked_sliders.mov