
Figure 9.
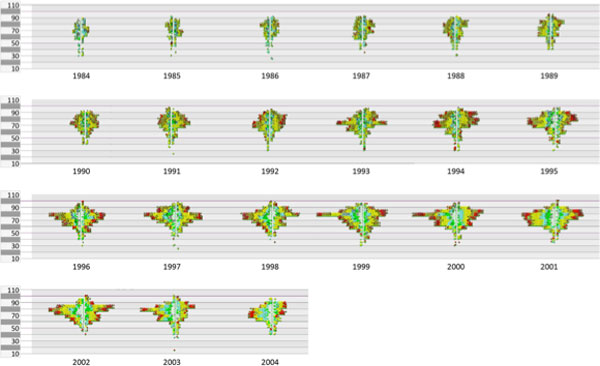
11.000 colon cancer cases grouped by the examination year. The visualization is done at the pixel level (figure9.png). 11.000 colon cancer cases, grouped by the examination year (1984 to 2004). For each year the glyphs are arranged in an age pyramid. A medical expert can overview a very large number of cases and recognise in a trend analysis several aspects, e.g. the increase of cases, shift in age distribution, increase in small tumors through by early warning programs, two outliners in the 1999/2000 for male patients in the age group 75-80 (no explanation yet).